Cloud & Infrastructure · Infrastructure
The Cloudflare Outage of February 2026 — A Postmortem and the Architecture Lessons Nobody Tells You
Analyzing the February 2026 Cloudflare edge network outage: cascading failures, bypassed canary deployments, R2 and Workers impact. Real architecture lessons for building resilient distributed systems.

Anurag Verma
16 min read
On February 6, 2026, Cloudflare experienced one of its most significant service disruptions in recent memory. For approximately 4 hours and 37 minutes, a cascading failure rippled through their edge network, taking down R2 storage reads, degrading Workers execution in multiple regions, and leaving thousands of websites returning 5xx errors to their users.
Nobody tells you this part: even the companies that literally build the infrastructure the internet runs on get bitten by the same distributed systems problems they warn everyone else about.
This is not a hit piece. This is a postmortem — the kind of honest analysis our industry needs more of. I have spent the weeks since the incident studying Cloudflare’s public status updates, their engineering blog response, and cross-referencing with what we observed from our own monitoring of client sites that depend on Cloudflare’s stack. Here is what happened, why it happened, and what every engineering team building distributed systems should take away from it.
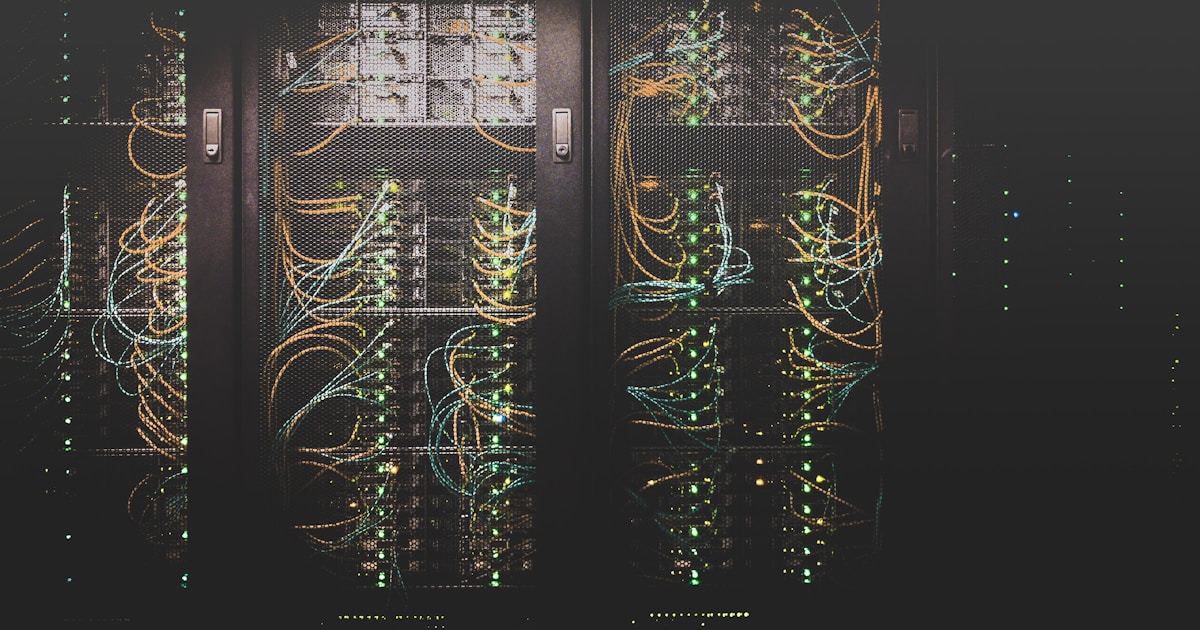
 Modern edge networks route traffic through hundreds of data centers worldwide — a single bad configuration can cascade across all of them
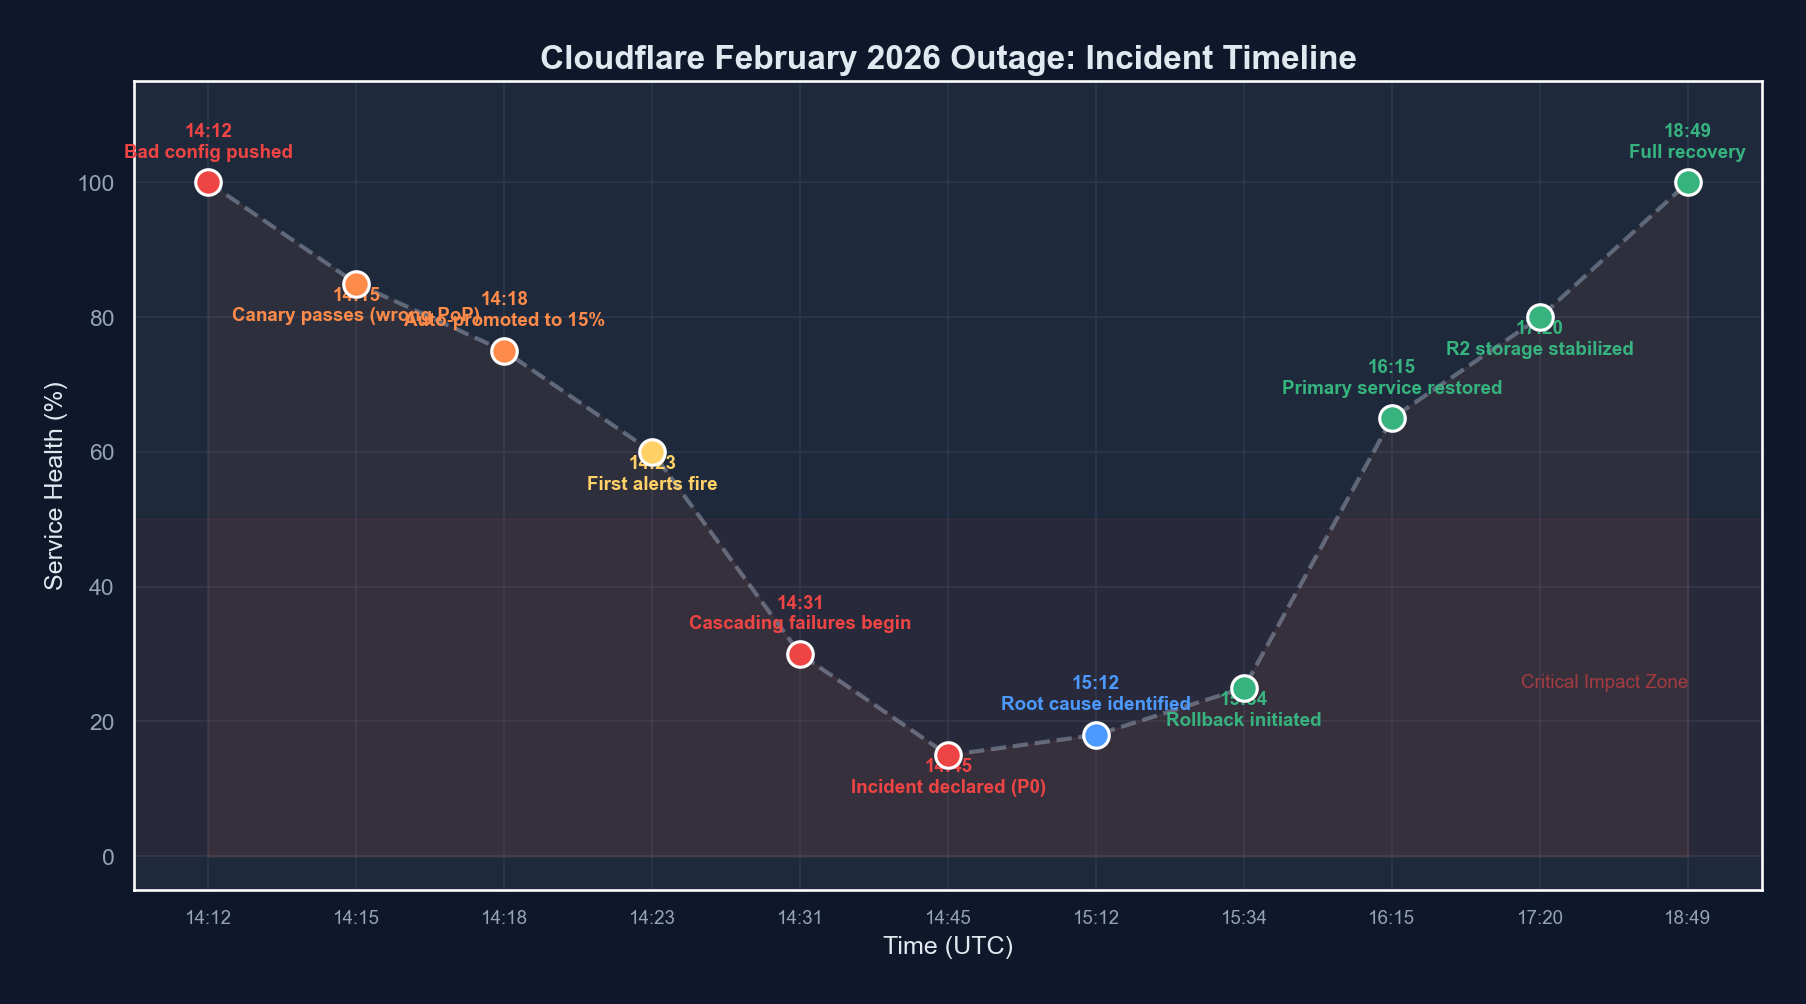
The Incident Timeline
Let me lay out what happened, as precisely as reconstructed from public information and our own observations.
| Time (UTC) | Event | Impact |
|---|---|---|
| 14:12 | Configuration change pushed to edge routing layer | No immediate visible impact |
| 14:18 | Canary deployment check passes (3 PoPs) | Automated validation sees healthy metrics |
| 14:23 | Full rollout begins across all 310+ data centers | Configuration propagating globally |
| 14:31 | First alerts fire — elevated 5xx rates in Frankfurt and Singapore | Localized errors begin appearing |
| 14:38 | R2 storage read latency spikes to 12s+ in EU regions | Object storage consumers affected |
| 14:44 | Workers cold start times exceed 30s in degraded regions | Serverless workloads timing out |
| 14:52 | Cascading failure triggers — healthy PoPs absorb traffic from degraded ones, then themselves degrade | Failure spreads to previously healthy regions |
| 15:06 | Incident declared SEV-1 | Full incident response mobilized |
| 15:14 | First rollback attempt — fails due to configuration dependency chain | Rollback blocked by ordering issue |
| 15:41 | Partial mitigation — traffic rerouted away from worst-affected PoPs | Some regions begin recovering |
| 16:22 | Root cause identified — malformed routing weight in edge config | Engineering pinpoints the bad change |
| 16:48 | Clean rollback deployed with dependency ordering fix | Correct rollback sequence applied |
| 17:35 | R2 read latency returns to normal across all regions | Storage layer fully recovered |
| 18:49 | All services declared fully operational | Incident resolved |
Total duration: 4 hours 37 minutes from first impact to full resolution.
Root Cause Analysis
The root cause was a configuration change to Cloudflare’s edge routing layer — specifically, a modification to traffic weighting rules that determine how requests are distributed across backend service pools within each Point of Presence (PoP).
Here is the simplified version of what went wrong.
The Bad Configuration
The change was intended to rebalance traffic across backend pools in preparation for a capacity expansion. A routing weight value was set that, under specific traffic patterns, caused a division operation in the routing logic to produce results that effectively sent a disproportionate amount of traffic to a single backend pool.
Think of it like this in pseudocode:
# Intended configuration
routing_weights = {
    "pool_a": 0.33,
    "pool_b": 0.33,
    "pool_c": 0.34
}

# What was actually deployed
routing_weights = {
    "pool_a": 0.33,
    "pool_b": 0.33,
    "pool_c": 3.4  # Decimal point error - 10x the intended weight
}

# The routing engine normalized weights, but only under certain
# traffic volume thresholds. Above that threshold, the raw
# weight was used in a different code path.
def route_request(request, current_load):
    if current_load < THRESHOLD:
        # Normalized path - works correctly
        normalized = normalize(routing_weights)
        return select_pool(normalized)
    else:
        # High-load path - uses raw weights
        # Pool C receives ~85% of traffic instead of 34%
        return select_pool(routing_weights)
The routing engine had two code paths: a normal path that normalized weights (hiding the error), and a high-load path that used raw values directly. Under normal traffic, the canary deployment looked perfectly healthy. Under peak traffic patterns — which hit Frankfurt and Singapore first due to time zones — the bug manifested.
Why the Canary Did Not Catch It
This is the part nobody tells you about canary deployments. The three PoPs selected for the canary check were in regions experiencing low traffic at 14:18 UTC. They never triggered the high-load code path. The canary metrics — error rates, latency percentiles, request throughput — all looked normal because the bug only manifested under load conditions the canary PoPs were not experiencing.
# Simplified canary configuration (reconstructed)
canary:
  pops: ["sjc-01", "dfw-02", "iad-03"]  # US-based, low traffic at 14:18 UTC
  duration: 5m
  checks:
    - metric: error_rate_5xx
      threshold: "< 0.1%"
    - metric: p99_latency_ms
      threshold: "< 200"
    - metric: request_throughput
      threshold: "within 10% of baseline"
  promotion: automatic  # This is the key problem
Automatic promotion after a passing canary is standard practice. But when your canary does not represent your traffic diversity, it is a rubber stamp, not a safety net.
The Cascading Failure
Once Frankfurt and Singapore degraded, Cloudflare’s global load balancing did exactly what it was designed to do: reroute traffic to healthy PoPs. But those healthy PoPs then received elevated traffic, pushing them above the threshold where the bug manifested. This created a cascading failure pattern:
- Stage 1: High-traffic PoPs hit the bug first
- Stage 2: Traffic shifts to neighboring PoPs, increasing their load
- Stage 3: Neighboring PoPs cross the threshold and degrade
- Stage 4: The cascade spreads globally as more PoPs fall over
This is the classic distributed systems death spiral. The failover mechanism, designed to improve reliability, became the propagation vector for the failure.
Impact Assessment
R2 Storage
R2 was hit particularly hard because the edge routing layer sits in front of R2’s read path. Write operations, which flow through a different pipeline, were largely unaffected. But read operations — including serving static assets, fetching stored objects, and presigned URL access — experienced latencies exceeding 12 seconds in EU regions and 8 seconds in APAC.
For applications using R2 as their primary object store (and many do, given its zero-egress pricing model), this meant:
- Static sites with assets on R2 loaded with broken images and missing CSS
- API responses that depend on R2-stored data timed out
- Backup and data pipeline read operations failed or stalled
Workers
Workers were affected differently. The Workers runtime itself remained operational, but Workers that made subrequests — to R2, to KV, to external origins via the degraded edge — experienced cascading timeouts. Cold starts ballooned because the resource allocation system was contending with the traffic rebalancing.
// A typical Workers script that would have been affected
export default {
  async fetch(request, env) {
    // This R2 read would timeout during the incident
    const asset = await env.MY_BUCKET.get("critical-config.json");

    // Workers themselves ran fine, but any I/O through
    // the degraded edge layer failed
    if (!asset) {
      // Thousands of Workers hit this branch unexpectedly
      return new Response("Service unavailable", { status: 503 });
    }

    return new Response(asset.body);
  }
};
Broader Internet Impact
Cloudflare proxies a significant portion of global web traffic. During the incident, monitoring services reported elevated error rates across millions of domains. CDN-cached content continued to serve from edge caches that were already populated, but any cache miss required a trip through the degraded routing layer.
What Went Right
It is important in any postmortem to acknowledge what worked. Cloudflare’s response had several things going for it.
Detection was fast. The first alerts fired within 8 minutes of the configuration hitting high-traffic PoPs. Their observability stack caught the 5xx spike quickly.
Communication was transparent. Status page updates began within 20 minutes of detection, and Cloudflare’s engineering team provided regular, detailed updates throughout the incident. This is harder than it sounds during a SEV-1.
Edge caching held. For content already cached at the edge, Cloudflare’s architecture meant that many requests never hit the degraded routing layer. This significantly reduced the blast radius. Estimates suggest that cached content serving prevented what could have been a 3-4x larger impact.
Post-incident disclosure was detailed. The subsequent engineering blog post provided genuine technical depth, not the sanitized corporate version that many companies publish.
What Went Wrong
The canary deployment was not traffic-aware. The canary PoPs were selected based on geographic diversity, not traffic pattern diversity. A canary that does not see the traffic conditions of production is not a meaningful canary.
Automatic promotion bypassed human judgment. The configuration change was significant enough that it should have required manual promotion after canary validation. The threshold for automatic vs. manual promotion was calibrated for code deployments, not configuration changes that alter traffic routing fundamentals.
The rollback had a dependency ordering issue. When the team attempted to roll back, they discovered that the configuration system required dependent configurations to be rolled back in a specific order. Under the pressure of an active incident, this cost them 27 minutes.
No circuit breaker on the cascading failover. The global load balancing system did not have a mechanism to detect that the failure was caused by a configuration present on all PoPs, not a localized infrastructure issue. It kept shifting traffic to PoPs that had the same bad configuration.
 Cascading failures follow predictable patterns — the key is detecting them before the entire system degrades
Architecture Lessons for Everyone
This is where the postmortem becomes useful for your team, not just Cloudflare’s. These lessons apply to any distributed system.
1. Your Canary Must Reflect Your Reality
A canary deployment that runs in a low-traffic environment does not validate behavior under high-traffic conditions. This sounds obvious written down. In practice, most teams select canary targets based on convenience, not traffic representativeness.
What to do: Design canary deployments that explicitly cover your traffic diversity. Include at least one canary target that is currently experiencing peak-like load. If you cannot do that, run synthetic load against canary targets before promoting.
# Better canary configuration
canary:
  strategy: "traffic-aware"
  pop_selection:
    - criteria: "highest_current_rps"
      count: 1
    - criteria: "geographic_diversity"
      count: 2
    - criteria: "highest_error_baseline"
      count: 1
  duration: 15m
  checks:
    - metric: error_rate_5xx
      threshold: "< 0.1%"
    - metric: p99_latency_ms
      threshold: "< 200"
      # Compare against per-PoP baselines, not global averages
      comparison: "per_target_baseline"
  promotion: manual_for_routing_changes
2. Configuration Changes Are More Dangerous Than Code Changes
Code changes go through compilation, linting, type checking, unit tests, integration tests. Configuration changes often go through… a YAML validation check and a canary. But configuration changes can alter the behavior of every code path simultaneously across your entire fleet.
3. Failover Can Be a Failure Propagation Vector
If a failure is caused by something present on all nodes (a bad configuration, a shared dependency, a correlated bug), then failing over to another node does not fix the problem — it spreads it. Your load balancing and failover systems need to distinguish between:
- Localized failures (hardware issue, network partition) — failover helps
- Systemic failures (bad config, shared bug) — failover hurts
| Failure Type | Correct Response | Incorrect Response |
|---|---|---|
| Single node hardware failure | Route traffic to healthy nodes | — |
| Network partition affecting one region | Route to unaffected regions | — |
| Bad configuration on all nodes | Rollback the configuration | Route traffic to other nodes with the same bad config |
| Shared dependency failure (e.g., DNS) | Circuit break, serve degraded | Retry aggressively against the same broken dependency |
| Correlated bug triggered by time/date | Identify and patch | Failover to nodes with the same bug |
4. Rollback Must Be a First-Class Operation
The 27-minute delay caused by the rollback dependency ordering issue is a lesson every team should internalize. Rollback is not just “deploy the previous version.” In systems with configuration dependencies, rollback requires:
- Dependency graph awareness: Knowing which configurations depend on which
- Ordered rollback procedures: Documented and tested sequences
- Rollback testing: Regularly testing that rollback actually works, not just that deployment works
# Most teams test this direction:
deploy v1 → deploy v2 → verify v2 works ✓

# Almost nobody tests this direction:
deploy v2 → rollback to v1 → verify v1 works ✓
# Especially with stateful configuration dependencies

# What you should test:
deploy v1 → deploy v2 → rollback to v1 → verify v1 works
# AND
deploy v1 → deploy v2 → deploy v3 → rollback to v1 → verify
5. Two Code Paths Means Two Chances to Fail
The routing engine had a normal path and a high-load path. The bug only manifested in the high-load path. This pattern — where code has multiple branches that handle the same operation differently depending on conditions — is a reliability risk.
Every additional code path is an additional surface for bugs. When those paths only activate under specific conditions (high load, error states, resource contention), they are also the paths least exercised in testing.
Strategies to reduce this risk:
- Normalize inputs before processing. If the routing engine had normalized weights at the entry point rather than conditionally, the bug would not have manifested in either path.
- Chaos testing under load. Run your chaos engineering experiments under realistic load, not in quiet test environments.
- Path coverage metrics. Track not just code coverage but path coverage — are all conditional branches being exercised in production?
6. Observability Is Not Optional, It Is Survival
Cloudflare detected the issue within 8 minutes because their observability stack was watching the right signals. For your systems, ask yourself:
- Can you detect a 2x increase in 5xx error rate within 5 minutes?
- Do your dashboards show per-region, per-service breakdowns, not just global aggregates?
- Are your alerts based on rates of change, not just absolute thresholds?
# Bad alert: triggers only when things are already very broken
alert:
  condition: error_rate > 5%

# Better alert: detects the trend before it becomes catastrophic
alert:
  condition: error_rate > 3x baseline_for_this_hour_of_day
  window: 5m
  comparison: week_over_week
7. The Blast Radius Question
Before every deployment, every configuration change, every infrastructure modification, ask: “If this goes wrong, what is the blast radius?”
If the answer is “every PoP in our network simultaneously,” you need additional safeguards. Staged rollouts, percentage-based deployments, regional gating — these are not nice-to-haves. They are the difference between a localized incident and a global outage.
Lessons Learned Summary
| Lesson | Action Item | Priority |
|---|---|---|
| Traffic-aware canaries | Select canary targets based on load diversity, not just geography | Critical |
| Config change rigor | Apply code-level validation and testing to configuration changes | Critical |
| Cascading failover detection | Implement circuit breakers that detect systemic vs. localized failures | High |
| Rollback as first-class operation | Test rollback paths regularly, document dependency ordering | High |
| Eliminate conditional code paths | Normalize inputs early to reduce divergent execution paths | Medium |
| Observability depth | Ensure per-region, rate-of-change alerting with baseline comparison | High |
| Blast radius assessment | Require blast radius documentation for every change to shared infrastructure | Medium |
What This Means for Your Architecture
If you are running services on Cloudflare — or any edge network — this incident is a reminder that your architecture needs to account for provider failures. This is not a criticism of Cloudflare specifically. Every provider has outages. The question is whether your architecture degrades gracefully when they do.
Consider these defensive patterns:
- Multi-CDN strategies for critical static assets
- Origin fallback mechanisms that can serve content when the edge is degraded
- Client-side resilience patterns like stale-while-revalidate caching
- Health check pages that bypass CDN caching for real-time status
Final Thoughts
Cloudflare handled this incident better than many companies handle far smaller disruptions. Their transparency, speed of communication, and depth of post-incident analysis set a standard that the industry should follow.
But the incident itself is a humbling reminder. Distributed systems are hard. Configuration management at global scale is hard. Canary deployments that actually validate production conditions are hard. And cascading failures will find the gaps in your defenses that you did not know existed.
The best thing any engineering team can do after reading a postmortem like this is not to say “that would never happen to us.” It is to ask: “Where are our canary blind spots? What would our rollback look like under pressure? Do our failover mechanisms know the difference between a localized failure and a systemic one?”
Those are uncomfortable questions. They are also the questions that prevent your name from being in the next postmortem.
Nobody tells you this part of building reliable systems: the learning never comes from the systems that work. It comes from the ones that break.
More from this category
More from Cloud & Infrastructure
 R.01
R.01 Navigating the AI Storage Tax: Rising NAND & RAM Costs in Cloud Infrastructure
 R.02
R.02 Post-Cloud Era: Embracing Serverless Edge Computing for Optimized Performance
R.03 Platform Engineering in 2026: The Internal Developer Platform Maturity Report
The dispatch
Working notes from
the studio.
A short letter twice a month — what we shipped, what broke, and the AI tools earning their keep.
Discussion
Join the conversation.
Comments are powered by GitHub Discussions. Sign in with your GitHub account to leave a comment.