Cloud & Infrastructure · Operations
Incident Response for Small Engineering Teams: SRE Without a Dedicated Ops Team
Site reliability engineering was designed for teams of hundreds. Most of its principles translate directly to teams of 5. Here is what a practical incident response process looks like when nobody has 'SRE' in their title.

Anurag Verma
9 min read

Sponsored
Production goes down at 2 AM on a Saturday. Your team has four engineers. Nobody has an SRE title. The postmortem culture at your company consists of a Slack message that says “ok fixed.”
This is the actual situation most engineering teams are in. The SRE literature — Google’s SRE book, the Seeking SRE anthology, the endless conference talks — describes teams with 20 engineers, dedicated tooling, follow-the-sun on-call rotations, and error budget policies reviewed by VPs. That’s genuinely useful material, but it doesn’t map directly to a team where the same person who wrote the broken code is also the one getting paged.
The principles, though, do translate. Here is what a functional incident response process looks like when you’re small.
Start with Severity Tiers
The first thing to define is what actually constitutes an incident and how urgently it needs a response. Without this, every alert feels like a crisis and every minor issue gets the same response as a production outage.
A four-tier system works for most small teams:
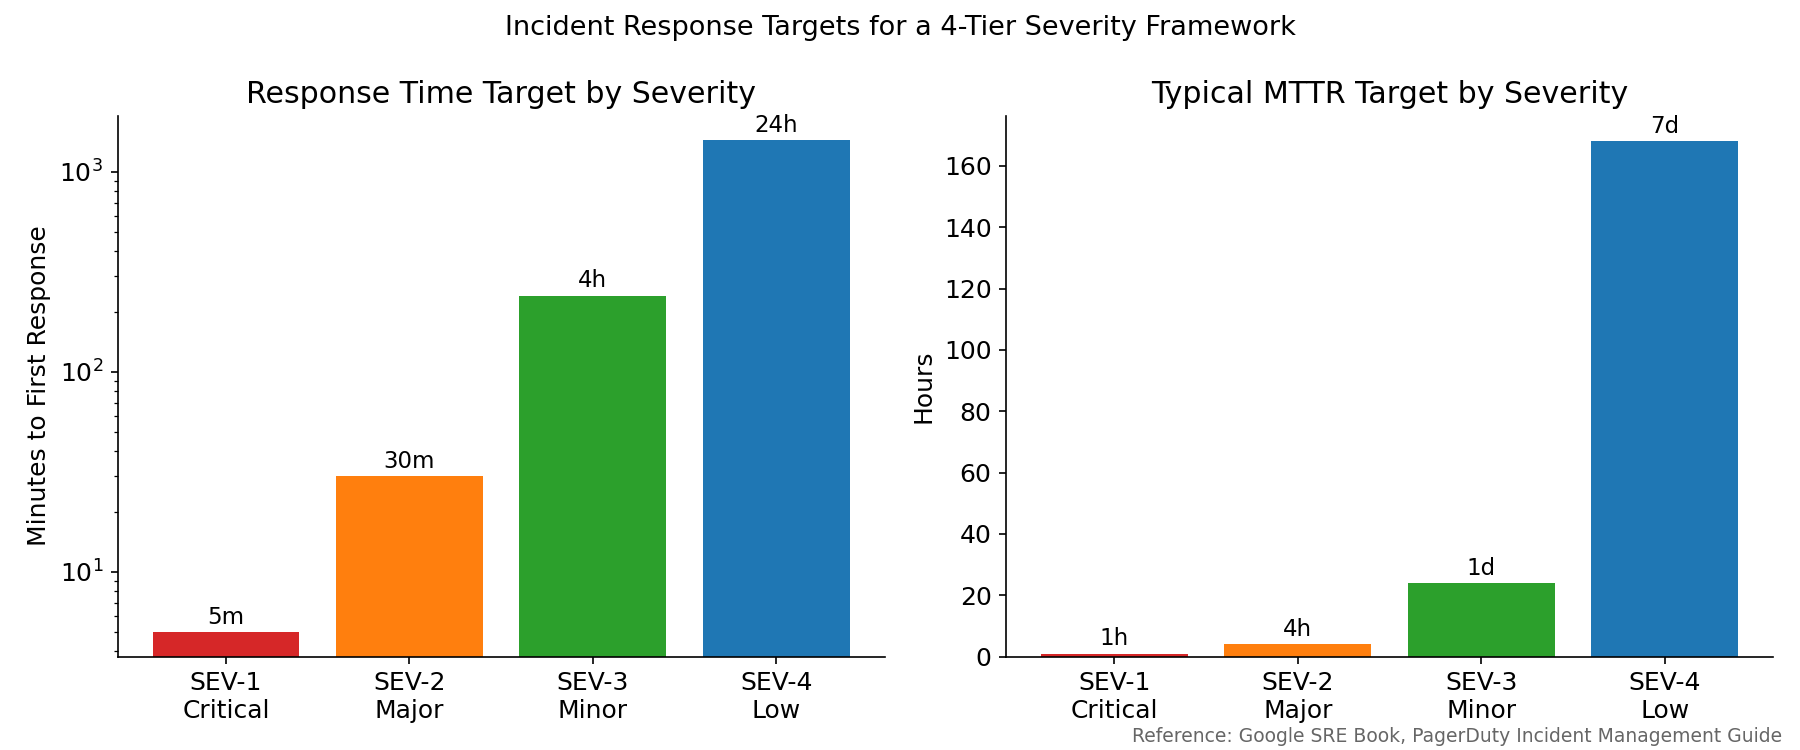
Response time and MTTR targets for a four-tier severity framework. Targets from Google SRE Book and PagerDuty’s incident management guide.
Write down what qualifies for each tier. Be specific. “Production is down” is not specific enough. Something like:
| Severity | Condition | Example |
|---|---|---|
| SEV-1 | Complete service outage OR data loss OR security breach | Site returns 500 to all users; database corrupted; credentials leaked |
| SEV-2 | Core feature broken for all users, or major feature broken for some users | Checkout flow failing; login broken for 20% of users |
| SEV-3 | Non-critical feature degraded or broken | Search returning wrong results; report generation slow |
| SEV-4 | Minor issue with workaround | A filter that most users never use is broken |
The exact thresholds don’t matter much. What matters is that there’s an agreed definition, so the person who gets paged at 2 AM knows immediately whether they need to wake someone else up.
On-Call Without On-Call Burnout
For a team of 4-8 engineers, on-call rotations are the right answer. “Everyone is on-call all the time” sounds fair in theory; in practice it means nobody is accountable and the most senior engineer always ends up handling incidents.
A rotation that avoids burning people out:
One primary, one backup. The primary gets paged first. If they don’t acknowledge within 5 minutes, the backup gets paged. The backup exists so the primary can take a shower.
One week rotations. Two weeks is too long. One week is long enough to build context without destroying a person’s personal life.
Business-hours bias. Configure your alerting so after-hours pages only fire for SEV-1 and SEV-2. SEV-3 and SEV-4 can wait until the next business day. This takes intentional configuration — most alerting tools default to paging for everything.
Schedule ahead. Publish the on-call schedule two weeks out minimum. People plan their lives. A Friday afternoon “hey can you be on-call this weekend” is how you lose engineers.
For tooling, PagerDuty and Opsgenie are the standard options. Both have free tiers that work fine for small teams. For very small teams, a simple Slack app with alertmanager routing is often enough — the important thing is that the escalation path is explicit, not that you’re using enterprise tooling.
Alerting That Doesn’t Lie to You
Alert fatigue is the silent killer of small-team incident response. When alerts fire constantly and most of them resolve on their own, the person on-call learns to ignore them. The one alert that actually mattered gets ignored too.
The goal is: every alert that fires requires a human response. If it doesn’t need a human, it shouldn’t page.
Alert on symptoms, not causes. Page when users are experiencing something bad. Don’t page on every intermediate metric that might eventually cause a user-visible problem.
# Bad: alerts on a cause that may or may not affect users
alert: HighCPU
condition: cpu_usage > 80%

# Better: alerts when the symptom is real
alert: HighErrorRate
condition: rate(http_requests_total{status=~"5.."}[5m]) > 0.05
# Page when 5% of requests are failing
Use multi-window multi-burn-rate alerts. Rather than alerting when error rate exceeds a threshold for 5 minutes (which fires false positives), alert when the error rate is consuming your error budget faster than sustainable. The Alertmanager and Prometheus documentation has worked examples of this. The Google SRE workbook has the mathematical foundation. The practical upshot: your SEV-2 alert fires when you’re burning through budget at 5x the sustainable rate, which means a real problem that warrants waking someone up.
Runbooks for every alert. Every alert that can fire should have a linked runbook: what the alert means, what to check first, and the decision tree for whether to escalate. Write these once, maintain them after each incident. The runbook doesn’t have to be long — three bullet points is better than nothing.
The First 15 Minutes of an Incident
The worst thing you can do when production is on fire is sit alone, not communicating, trying to fix it quietly. Nobody finds out what’s happening, nobody can help, and if you’re wrong about the cause you’ve spent 45 minutes going down the wrong path while things stayed broken.
The first 15 minutes should look like this:
- Acknowledge the alert (stops escalation to backup)
- Open an incident channel in Slack (or whatever your team uses):
#incident-2026-05-16-0215 - Post an initial assessment in that channel: “Site seeing elevated errors. Investigating cause. Users affected: all. Started: ~2:12 AM UTC.”
- Page the backup or on-call lead if it’s SEV-1 or you don’t know the cause within 5 minutes
- Designate an incident commander if more than one person is involved — this person coordinates, the others investigate
The incident commander doesn’t fix the problem. They ensure someone is investigating, keep stakeholders updated, and make the call to escalate or declare resolution. On a small team, this might be the same person as the investigator, but at SEV-1 incidents you want at least two people: one investigating, one coordinating.
Status updates on a cadence. Post an update every 15 minutes, even if the update is “no new information, still investigating.” Silence during an outage is more anxiety-inducing than a “we still don’t know” update. If you have external customers, a status page (Statuspage, Cachet, or even a plain Netlify site with manual updates) keeps inbound noise off your Slack.
Diagnosing Faster
Speed of diagnosis comes from two things: knowing where to look and having the data available when you need it.
Structured logging with correlation IDs. Every request gets a unique ID. Every log line from that request includes the ID. When a customer reports “order 12345 failed,” you can run a single query and see every log line associated with that order across every service.
# Python example: structured logging with request ID
import logging
import uuid
from contextvars import ContextVar

request_id_var: ContextVar[str] = ContextVar('request_id', default='')

class RequestIDFilter(logging.Filter):
    def filter(self, record):
        record.request_id = request_id_var.get('')
        return True

# In request handler:
request_id_var.set(str(uuid.uuid4()))
# All log.info(), log.error() calls now include request_id automatically
Dashboards for the key metrics. During an incident, you want to look at one place and understand the state of the system. A dashboard with error rate, latency percentiles (p50, p95, p99), throughput, and downstream dependency health covers most incidents. Grafana is the standard; Datadog and New Relic work if you’re already paying for them. The important thing is the dashboard exists before the incident, not that you’re building queries in real time while users are affected.
Recent deployments are the first suspect. The majority of production incidents are caused by a deployment in the last few hours. Make it trivial to see what was deployed when. A simple Slack notification when a deploy completes, with a link to the diff, means the on-call engineer can see in 30 seconds whether a recent change is the likely cause.
Postmortems That Actually Help
The blameless postmortem is a well-understood concept. The goal is to understand the systemic failure — why was the system designed in a way that allowed this failure to happen, what conditions contributed to it, how did the incident cascade — rather than finding whose fault it was.
For small teams, the postmortem doesn’t need to be formal. It needs to answer four questions:
- What happened? Timeline from detection to resolution.
- Why did it happen? Root cause — the underlying condition that made the failure possible. “Developer made a mistake” is not a root cause; “there was no staging environment where this failure mode could have been caught” is.
- What made it worse? Alert fatigue, unclear runbooks, missing dashboards, long detection time.
- What changes prevent recurrence? Concrete action items, assigned owners, with deadlines.
The action items are the most important part. A postmortem with no follow-through is just a paper trail.
Post the document somewhere the whole team can see it. Make it searchable. Six months from now when something similar happens, the first step is searching your postmortem history.
What Small Teams Often Skip and Shouldn’t
Testing the on-call process. Run a fire drill once a quarter. Pick a non-production service, deliberately break it, and have the on-call engineer respond as if it were real. You’ll find gaps in your runbooks, alert routing, and tooling access before they matter.
Access management review. Incidents sometimes go long because the on-call engineer doesn’t have access to the production environment, or doesn’t have the right IAM permissions to restart a service, or can’t push an emergency fix because the deployment pipeline requires a code review that nobody is awake to approve. Document the access your on-call engineers need and make sure they have it before they need it.
On-call shadowing. Junior engineers should shadow on-call rotations before they’re on-call themselves. Run a one-week shadow rotation where the junior engineer gets all pages but is not expected to respond independently — they observe and ask questions. This is the fastest way to transfer institutional knowledge.
SRE at scale is a discipline with a career track, an org structure, and its own interview process. SRE at small-team scale is mostly just: know what’s broken when it’s broken, know who to call, and make sure the same thing doesn’t break twice. That’s achievable with a two-day setup effort and an hour a month of maintenance.
Sponsored
More from this category
More from Cloud & Infrastructure
R.01 Database Connection Pooling in 2026: PgBouncer, Supabase, and Prisma Accelerate
 R.02
R.02 Secrets Management in Production: The Patterns That Actually Work
 R.03
R.03 Service Mesh in 2026: Do You Actually Need Istio, Linkerd, or Cilium?
Sponsored
The dispatch
Working notes from
the studio.
A short letter twice a month — what we shipped, what broke, and the AI tools earning their keep.
Discussion
Join the conversation.
Comments are powered by GitHub Discussions. Sign in with your GitHub account to leave a comment.
Sponsored