Cloud & Infrastructure · Observability
eBPF in 2026: The Observability Superpower Hiding in Your Linux Kernel
eBPF lets you attach programs to any kernel hook — network packets, system calls, function calls — without patching the kernel or rebooting. Here's what application developers actually need to know.

Anurag Verma
7 min read

Sponsored
Your application is slow. The profiler says 40% of time is spent in read() and write(). The network looks fine in Prometheus. The database queries are fast. Something is happening between the application code and the hardware, and your current toolset has no window into it.
This is the gap eBPF was built for.
eBPF (extended Berkeley Packet Filter) is a Linux kernel technology that lets you run sandboxed programs inside the kernel without modifying its source code or loading a module. You write a small program in C (or a higher-level language), compile it to eBPF bytecode, attach it to a kernel hook, and it runs with very low overhead on every event that triggers that hook.
The events available: network packets at any layer of the stack, system calls, kernel function entry and exit, user-space function entry and exit, hardware performance counters, scheduled process events. Essentially: anything the kernel knows about, you can observe.
This is not new technology. eBPF has been production-stable since Linux 4.4 (2016). What’s changed is the tooling around it. In 2026, you don’t need to understand BPF bytecode or write kernel-level C to use it. Tools like Cilium, Pixie, and bpftrace have made most common observability use cases point-and-click or single-command.
How eBPF Actually Works
When you load an eBPF program, the kernel runs it through a verifier before executing it. The verifier checks that the program terminates (no infinite loops), doesn’t access memory out of bounds, and doesn’t call unsafe functions. Programs that don’t pass verification are rejected. This is what makes eBPF safe to run in production without the risks that come with kernel modules.
After verification, the kernel’s JIT compiler translates the bytecode to native machine instructions. The overhead is close to zero for most hooks — typically a few hundred nanoseconds per event, compared to a few microseconds for context-switching to user space.
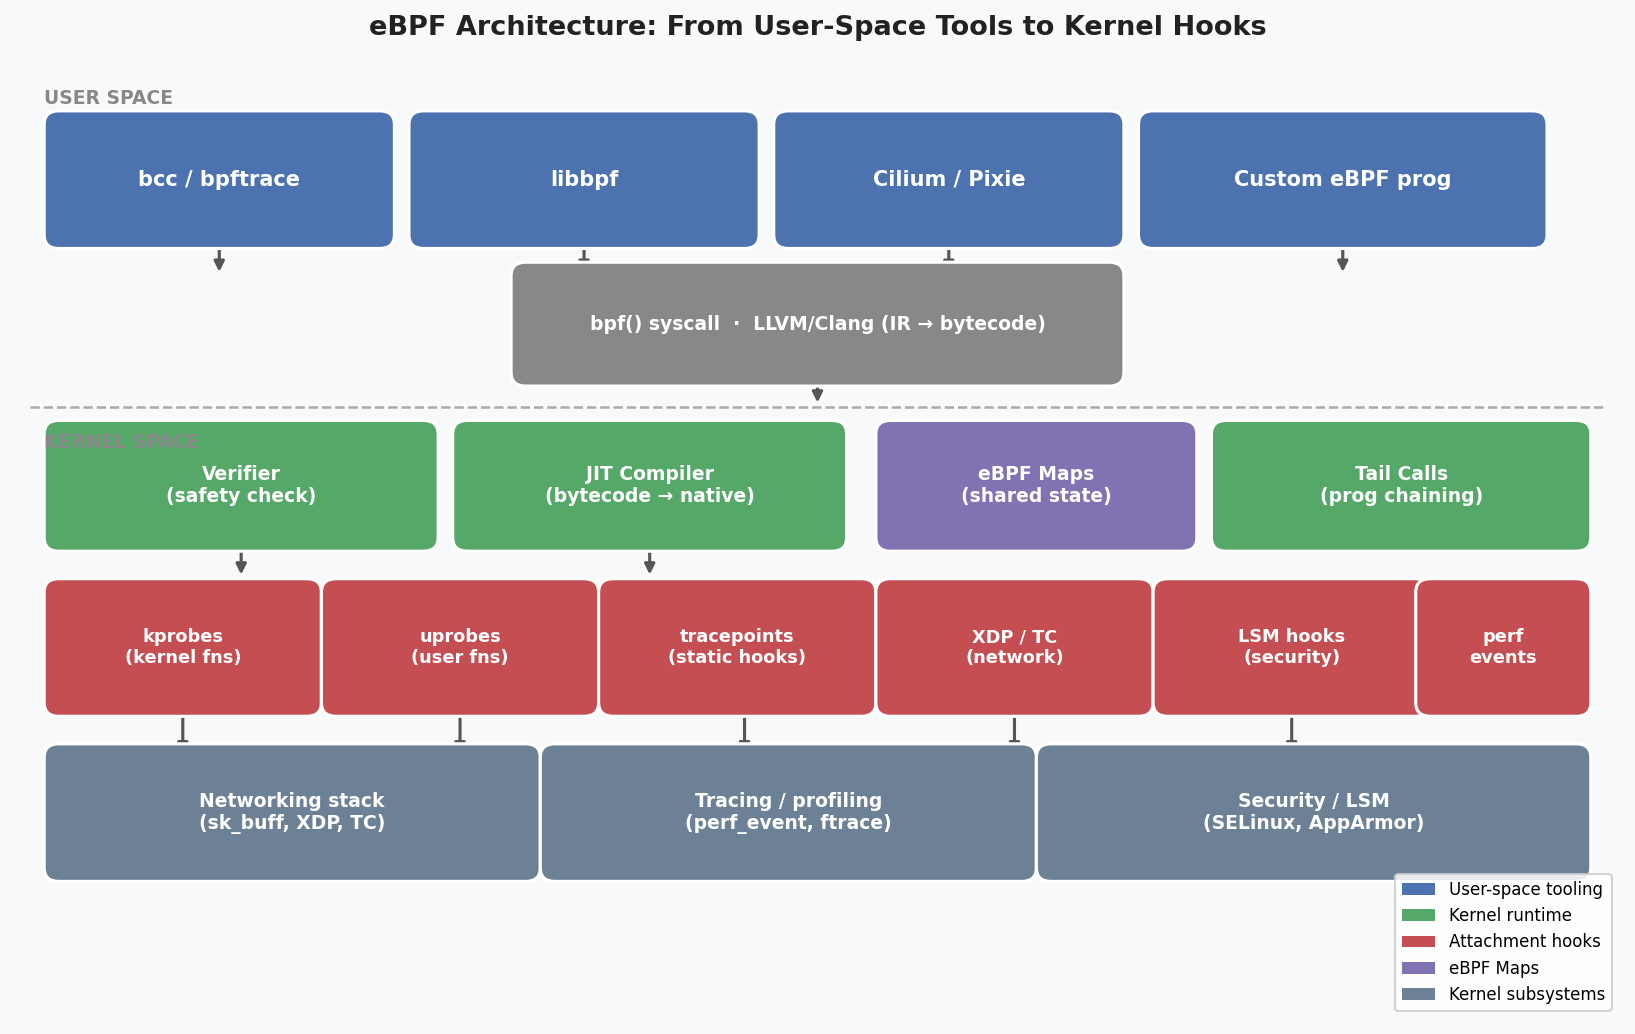
Programs communicate with user space through eBPF maps: data structures in kernel memory that both the eBPF program and user-space tools can read and write. A tracing program might write latency measurements to a map; a user-space agent reads the map periodically and exports metrics to Prometheus.
What You Can Do With It (Without Writing C)
Distributed Tracing Without Instrumentation
The standard approach to distributed tracing requires adding OpenTelemetry to every service, propagating trace contexts through HTTP headers, and exporting spans to a collector. For a system you own, this works. For third-party services, legacy code, or services you can’t modify, it doesn’t.
eBPF can intercept syscalls and network calls at the kernel level and reconstruct trace data automatically. Pixie, which was open-sourced after Kubernetes absorbed it, does this:
# Install Pixie on your Kubernetes cluster
px deploy

# Then query traces without any application code changes
px run px/http_data -- --start_time '-5m'
The output shows HTTP requests, response codes, and latencies for every service on the cluster, including ones that have no instrumentation code at all.
Network Performance Without a Service Mesh
Service meshes like Istio add mTLS, traffic management, and observability by injecting a sidecar proxy into every pod. The proxy intercepts all traffic, which adds latency (typically 5-15ms per hop) and memory overhead (typically 50-100MB per sidecar).
Cilium provides the same capabilities using eBPF instead of proxies. Traffic policies are enforced in the kernel, not by a sidecar process. The overhead is closer to 1-2ms and there’s no additional container to manage.
# Cilium NetworkPolicy — enforced in the kernel, not a sidecar
apiVersion: cilium.io/v2
kind: CiliumNetworkPolicy
metadata:
  name: allow-api-to-database
spec:
  endpointSelector:
    matchLabels:
      app: postgres
  ingress:
    - fromEndpoints:
      - matchLabels:
          app: api-service
      toPorts:
      - ports:
        - port: "5432"
          protocol: TCP
Cilium 1.16 (released late 2025) added full Kubernetes Gateway API support and mutual authentication without sidecars.
CPU Profiling in Production
Profiling typically requires either adding profiling instrumentation to your code (which changes behavior) or stopping the process to attach a profiler (which isn’t safe in production). eBPF-based profilers can collect stack traces continuously with overhead under 1%.
# bpftrace: sample CPU stacks every 49Hz for 30 seconds
sudo bpftrace -e 'profile:hz:49 { @[kstack] = count(); } interval:s:30 { exit(); }'

# Or with a specific process ID
sudo bpftrace -e 'profile:hz:99 /pid == 12345/ { @[ustack] = count(); }'
Parca (parca.dev) and Grafana Pyroscope both have eBPF-based agents that run this continuously and feed flame graphs to their dashboards. No code changes, no per-language agents, no overhead beyond the profiling itself.
System Call Auditing
Need to know exactly which files a process opens, or which network connections it makes? strace works but adds enormous overhead because it intercepts every syscall via ptrace. eBPF tracing adds almost none:
# Watch all open() calls for a given process with bpftrace
sudo bpftrace -e 'tracepoint:syscalls:sys_enter_openat /pid == 12345/ {
  printf("%s opened: %s\n", comm, str(args->filename));
}'
This runs continuously in production with negligible impact.
Tools to Know in 2026
bpftrace — one-liner and scripting tool for ad-hoc kernel tracing. The Swiss Army knife for debugging kernel behavior without writing C. Ships with most modern Linux distributions.
bcc (BPF Compiler Collection) — Python-based toolkit with 70+ ready-made tools: execsnoop, biolatency, tcpconnect, runqlat, and more. Good starting point for common observability tasks.
Cilium — Kubernetes networking and security using eBPF. Replaces kube-proxy and optionally replaces a service mesh. Production-grade, CNCF graduated.
Pixie — Open-source observability for Kubernetes with automatic instrumentation. No code changes needed, traces HTTP/gRPC/MySQL/Redis by default.
Falco — Container runtime security using eBPF. Detects anomalous behavior (unexpected file writes, privilege escalation attempts) in real time.
Inspektor Gadget — Collection of eBPF-based tools designed for Kubernetes, wrapped with kubectl integration.
When Not to Use eBPF
eBPF requires Linux. It doesn’t run on Windows, macOS, or in most managed cloud environments where you don’t have access to kernel-level hooks (though this is improving — EKS, GKE, and AKS all support eBPF-based tools with the right node configurations).
The minimum Linux kernel version for most useful eBPF features is 5.4+. Older enterprise distributions (RHEL 7, Ubuntu 18.04) have limited support. Check with uname -r and bpftool feature.
You also don’t need eBPF when standard application-level instrumentation is sufficient. If your service already exports OpenTelemetry spans and your team can add instrumentation, that’s usually the right level of abstraction. eBPF shines for what application-level instrumentation can’t see: kernel behavior, cross-service network flows without code changes, and performance analysis of third-party code.
A Practical Starting Point
If you’re on Kubernetes and want to evaluate eBPF-based observability without committing to infrastructure changes, Pixie is the lowest-friction option. You deploy it to a cluster, it instruments everything automatically, and you get HTTP traces, service maps, and resource metrics within minutes.
# Requires Pixie CLI installed (px)
px deploy --cluster_name my-cluster

# View a service topology with latency data
px run px/service_stats -- --start_time '-15m' --service 'api-service'
For security-focused use cases, try Falco on a single node first. The default ruleset catches common attack patterns (shell spawned inside a container, unexpected network connections from a web server) and gives you a sense of the signal-to-noise ratio before committing to a full deployment.
The kernel has been tracking everything your application does all along. eBPF is the first practical way to read that data without modifying the kernel or accepting prohibitive overhead. For teams running production workloads on Linux, it’s worth understanding what’s now possible.
Sponsored
More from this category
More from Cloud & Infrastructure
 R.01
R.01 Blue-Green and Canary Deployments: A Production Guide for Engineering Teams
 R.02
R.02 Tailscale for Distributed Dev Teams: Private Networks Without the VPN Pain
 R.03
R.03 Multi-Cloud vs Single Cloud in 2026: An Honest Cost-Benefit Analysis
Sponsored
The dispatch
Working notes from
the studio.
A short letter twice a month — what we shipped, what broke, and the AI tools earning their keep.
Discussion
Join the conversation.
Comments are powered by GitHub Discussions. Sign in with your GitHub account to leave a comment.
Sponsored