Business · Leadership
Developer Productivity Metrics — Understanding DORA, SPACE, and What Actually Matters in 2026
Measuring developer productivity is notoriously difficult. DORA and SPACE frameworks offer research-backed approaches, but implementation is where most teams fail.

Anurag Verma
7 min read
Measuring developer productivity is one of the most contentious topics in software engineering. Naive metrics (lines of code, commit counts) are easily gamed and often harmful. But ignoring productivity entirely leaves teams without the data needed to improve.
The DORA and SPACE frameworks offer research-backed approaches to measuring what matters. Understanding them helps engineering leaders make better decisions.
Good metrics inform decisions. Bad metrics drive dysfunctional behavior.
Why Productivity Metrics Are Hard
Developer work is complex and creative. Simple metrics fail because:
| Metric | Problem |
|---|---|
| Lines of code | Punishes clean, minimal solutions |
| Commits per day | Encourages meaningless commits |
| Story points completed | Points are estimated inconsistently |
| Hours worked | Measures presence, not output |
| Pull requests merged | Encourages small, trivial PRs |
Every naive metric can be gamed or drives perverse incentives.
The DORA Framework
DORA (DevOps Research and Assessment) metrics emerged from Google’s multi-year research into high-performing engineering teams. The research identified four key metrics that correlate with both delivery performance and organizational performance.
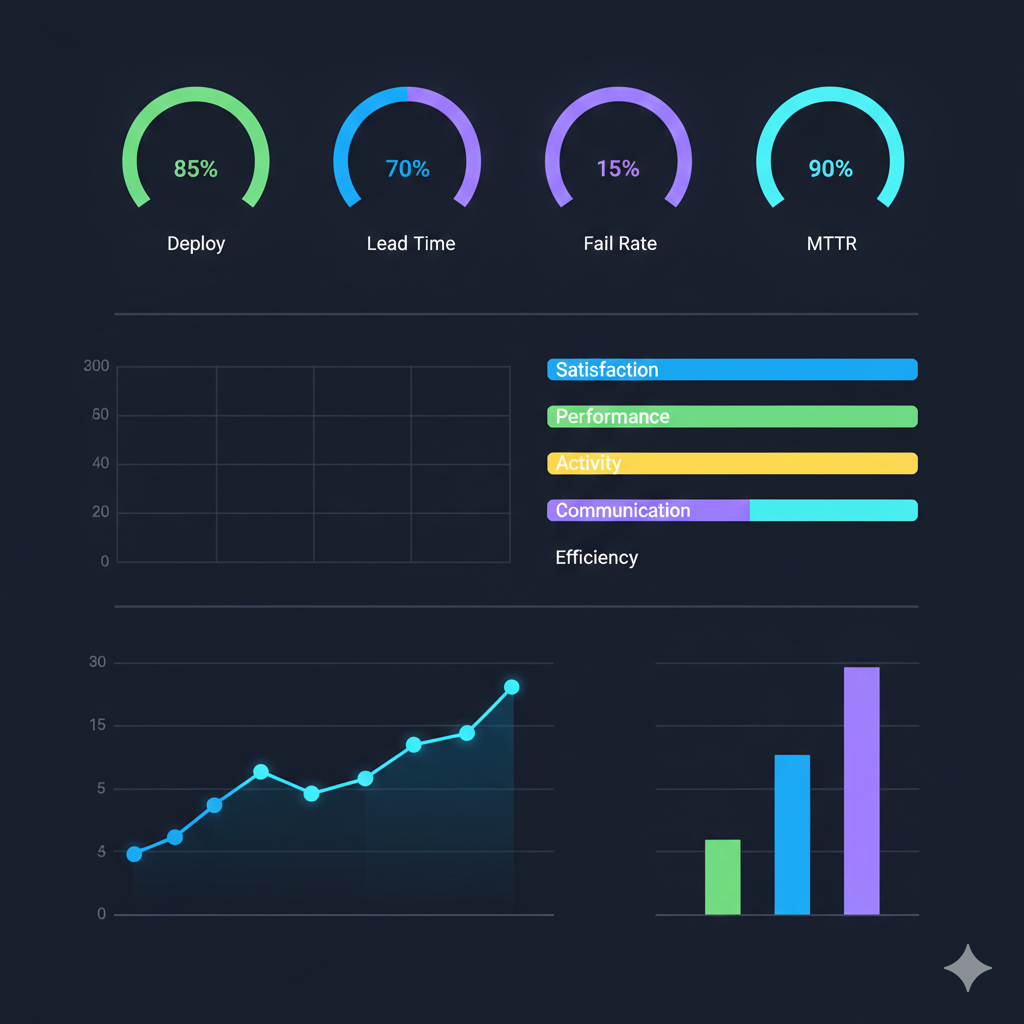
The Four DORA Metrics
1. Deployment Frequency
How often does your organization deploy code to production?
| Level | Frequency |
|---|---|
| Elite | Multiple times per day |
| High | Weekly to monthly |
| Medium | Monthly to every 6 months |
| Low | Longer than 6 months |
2. Lead Time for Changes
How long from code commit to code running in production?
| Level | Lead Time |
|---|---|
| Elite | Less than one hour |
| High | One day to one week |
| Medium | One week to one month |
| Low | More than one month |
3. Change Failure Rate
What percentage of deployments cause a failure in production?
| Level | Failure Rate |
|---|---|
| Elite | 0-15% |
| High | 16-30% |
| Medium | 16-30% |
| Low | 46-60% |
4. Mean Time to Recover (MTTR)
How long does it take to recover from a failure in production?
| Level | Recovery Time |
|---|---|
| Elite | Less than one hour |
| High | Less than one day |
| Medium | One day to one week |
| Low | More than one month |
Why DORA Works
DORA metrics focus on outcomes (delivery performance) rather than activities (individual behavior). They are:
- Team-level: Not individual metrics
- Objective: Based on deployment and incident data
- Correlated with business outcomes: Research shows connection to organizational performance
- Hard to game: Improving these metrics genuinely improves delivery
Implementing DORA
DORA Measurement Sources
├── Deployment Frequency
│   └── Source: CI/CD pipeline, deployment logs
│
├── Lead Time for Changes
│   └── Source: Git commits + deployment timestamps
│
├── Change Failure Rate
│   └── Source: Incident management + deployment correlation
│
└── Mean Time to Recover
    └── Source: Incident management system
Tools like LinearB, Sleuth, and Faros aggregate this data automatically.
The SPACE Framework
SPACE, developed by GitHub and Microsoft researchers, takes a broader view of developer productivity, acknowledging that productivity is multidimensional.
The Five SPACE Dimensions
S — Satisfaction and Well-being
How fulfilled and happy are developers with their work?
Measured via:
- Developer surveys
- Retention rates
- eNPS (employee Net Promoter Score)
P — Performance
What is the outcome of the work?
Measured via:
- Code review quality
- Customer satisfaction
- Feature adoption
- Reliability
A — Activity
Count of actions or outputs.
Measured via:
- PRs merged, commits, code reviews
- Documentation written
- Bugs fixed
C — Communication and Collaboration
How effectively do people work together?
Measured via:
- Code review turnaround time
- Knowledge sharing
- Cross-team collaboration
E — Efficiency and Flow
Can developers work without interruption?
Measured via:
- Uninterrupted focus time
- Handoffs and wait times
- Tool and process friction
Why SPACE Works
SPACE acknowledges that:
- Productivity is multidimensional. No single metric captures it.
- Developer satisfaction matters. Unhappy developers are less productive and leave.
- Context matters. What’s important varies by team, project, and phase.
Implementing SPACE
Select 2-3 metrics from at least 3 dimensions:
Example SPACE Implementation
├── Satisfaction (S)
│   └── Quarterly developer survey
│
├── Activity (A)
│   └── PRs merged per week (team level)
│
├── Efficiency (E)
│   └── PR cycle time (open to merge)
│
└── Performance (P)
    └── Change failure rate (from DORA)
DORA vs SPACE
| Aspect | DORA | SPACE |
|---|---|---|
| Focus | Delivery performance | Holistic productivity |
| Metrics | 4 specific metrics | Framework for choosing metrics |
| Measurement | Mostly automated | Mix of automated and survey |
| Research basis | Multi-year industry study | Academic research |
| Best for | DevOps/delivery improvement | Overall developer experience |
Many organizations use both — DORA for delivery metrics, SPACE for broader productivity and satisfaction.
What to Avoid
Individual Metrics
Never use productivity metrics to evaluate individual developers.
Why:
- Developers will game metrics
- Collaboration suffers (why help others if it hurts your metrics?)
- Creative work does not fit neat measurement
- Trust erodes
Instead: Use team-level metrics for team improvement, performance reviews for individuals.
Vanity Metrics
Metrics that look good but do not drive improvement:
| Vanity Metric | Better Alternative |
|---|---|
| Total commits | Deployment frequency |
| Lines added | Change failure rate |
| PRs opened | PR cycle time |
| Story points | Lead time for changes |
Measuring Without Action
Metrics are pointless without improvement efforts:
Metrics → Insights → Actions → Improvement
                              ↑
                     Most teams stop here
If you measure deployment frequency but never invest in CI/CD, the metric is waste.
Practical Implementation
Start Simple
Begin with 3-4 metrics maximum:
- Deployment Frequency — How often we ship
- PR Cycle Time — How fast we review and merge
- Developer Satisfaction — Quarterly survey
- Change Failure Rate — How often deployments break
Automate Collection
Manual metric collection fails. Integrate with existing tools:
Automation Sources
├── Deployment Frequency: GitHub Actions, CircleCI, etc.
├── PR Cycle Time: GitHub/GitLab APIs
├── Change Failure Rate: PagerDuty, Opsgenie + deployment correlation
└── Developer Satisfaction: Slack surveys, dedicated tools
Review Regularly
Monthly or quarterly reviews:
- What changed? Review metric trends
- Why? Investigate causes of changes
- What action? Decide on improvement efforts
- Who owns? Assign responsibility
Communicate Openly
Share metrics with the team:
- Transparency builds trust. Hiding metrics creates suspicion.
- Team input improves accuracy. Developers can explain anomalies.
- Shared ownership drives improvement. Everyone works toward goals.
Metrics That Actually Help
Based on experience, these metrics provide the most value:
For Delivery Speed
- Deployment Frequency: Are we shipping often?
- Lead Time (commit to production): How fast from done to deployed?
- PR Cycle Time: How fast from PR opened to merged?
For Quality
- Change Failure Rate: Are our changes breaking things?
- MTTR: How fast do we recover?
- Bug Escape Rate: How many bugs reach production?
For Developer Experience
- Developer Satisfaction Score: Do developers like working here?
- Onboarding Time: How long until new developers are productive?
- Build/Test Time: How much waiting do developers do?
For Collaboration
- Code Review Turnaround: How long for first review?
- Bus Factor: How distributed is knowledge?
- Cross-team Contribution: Is work siloed?
The Human Side
Metrics inform but do not replace judgment. Remember:
-
Context matters. A team building safety-critical systems should have different deployment frequency than a B2C app.
-
Trends matter more than absolutes. Improving from weekly to daily deploys is more important than comparing to industry benchmarks.
-
Metrics can be gamed. Watch for behavior that improves metrics without improving actual outcomes.
-
Developer trust is essential. Metrics used punitively destroy trust and make measurement useless.
Good metrics are tools for teams to improve their own performance — not surveillance for management. Use them wisely.
More from this category
More from Business
 R.01
R.01 Samsung Galaxy Z TriFold Discontinued: Challenges in the Foldable Market
 R.02
R.02 Biopharma SHAKTI — India's Rs 10,000 Cr Bet on Biopharmaceutical Innovation
 R.03
R.03 Lenskart IPO Lock-In Expires — Rs 30,000 Crore Share Unlock & What Investors Should Know
The dispatch
Working notes from
the studio.
A short letter twice a month — what we shipped, what broke, and the AI tools earning their keep.
Discussion
Join the conversation.
Comments are powered by GitHub Discussions. Sign in with your GitHub account to leave a comment.