Cloud & Infrastructure · Kubernetes
KEDA, VPA, and Goldilocks: Kubernetes Autoscaling Beyond the HPA in 2026
HPA scales on CPU and memory. But most production workloads don't scale well on those signals. KEDA, VPA, and Goldilocks fill the gaps that HPA leaves open.

Anurag Verma
9 min read

Sponsored
The Horizontal Pod Autoscaler was the right starting point. CPU utilization is measurable, stable, and directly tied to request load for most stateless HTTP services. For a web API that spends most of its time in synchronous request processing, scaling on CPU makes sense.
It makes less sense for a message queue consumer that pulls from SQS. When the queue fills up, the consumer is blocked waiting for work — CPU might be low while thousands of messages pile up. HPA sees calm metrics. Users see latency climbing.
KEDA, VPA, and Goldilocks address the three gaps the HPA leaves open: event-driven scaling triggers, right-sized resource requests, and recommendations for what those requests should be.
What HPA Gets Right (and Where It Stops)
HPA watches a metric — traditionally CPU or memory utilization, or custom metrics via the Kubernetes Metrics API — and adjusts the replica count for a Deployment or StatefulSet.
The cooldown window (scale up: 3 minutes, scale down: 5 minutes by default in recent Kubernetes versions) prevents flapping. The algorithm: if observed metric / target metric > 1, scale up. If < 1, scale down.
This works well when:
- Your workload is CPU-bound or memory-bound
- Request load and CPU utilization correlate closely
- Scaling on replicas is the right response to load
It falls short when:
- Your trigger isn’t CPU: queue depth, event rate, Prometheus metric, cron schedule
- Your workload is I/O-bound and sits at low CPU while backed up
- You need to scale to zero (HPA minimum replica count is 1)
KEDA: Kubernetes Event-Driven Autoscaling
KEDA is a CNCF-graduated project that extends Kubernetes autoscaling with an event source model. Where HPA has two built-in triggers (CPU, memory), KEDA has over 60 scalers including Kafka, RabbitMQ, Redis, AWS SQS, Azure Service Bus, PostgreSQL, and HTTP traffic.
It also scales to zero. A deployment with no pending work can run zero replicas. When events arrive, KEDA scales the deployment up before the work is processed.
# ScaledObject: tells KEDA how to scale your deployment
apiVersion: keda.sh/v1alpha1
kind: ScaledObject
metadata:
  name: order-processor
  namespace: production
spec:
  scaleTargetRef:
    name: order-processor-deployment
  minReplicaCount: 0    # Scale to zero when queue is empty
  maxReplicaCount: 30
  cooldownPeriod: 60    # Seconds before scaling to zero after queue empties
  triggers:
    - type: aws-sqs-queue
      metadata:
        queueURL: https://sqs.us-east-1.amazonaws.com/123456789/orders
        queueLength: "20"       # Target: 20 messages per replica
        awsRegion: us-east-1
        identityOwner: pod      # Use the pod's IAM role (IRSA)
With queueLength: "20", KEDA targets 20 messages per replica. If the queue has 200 messages, KEDA scales to 10 replicas. If 600, it scales to 30 (the max). When the queue empties, it scales down to zero after the cooldown period.
The chart below shows the behavioral difference between HPA and KEDA when a message spike arrives.
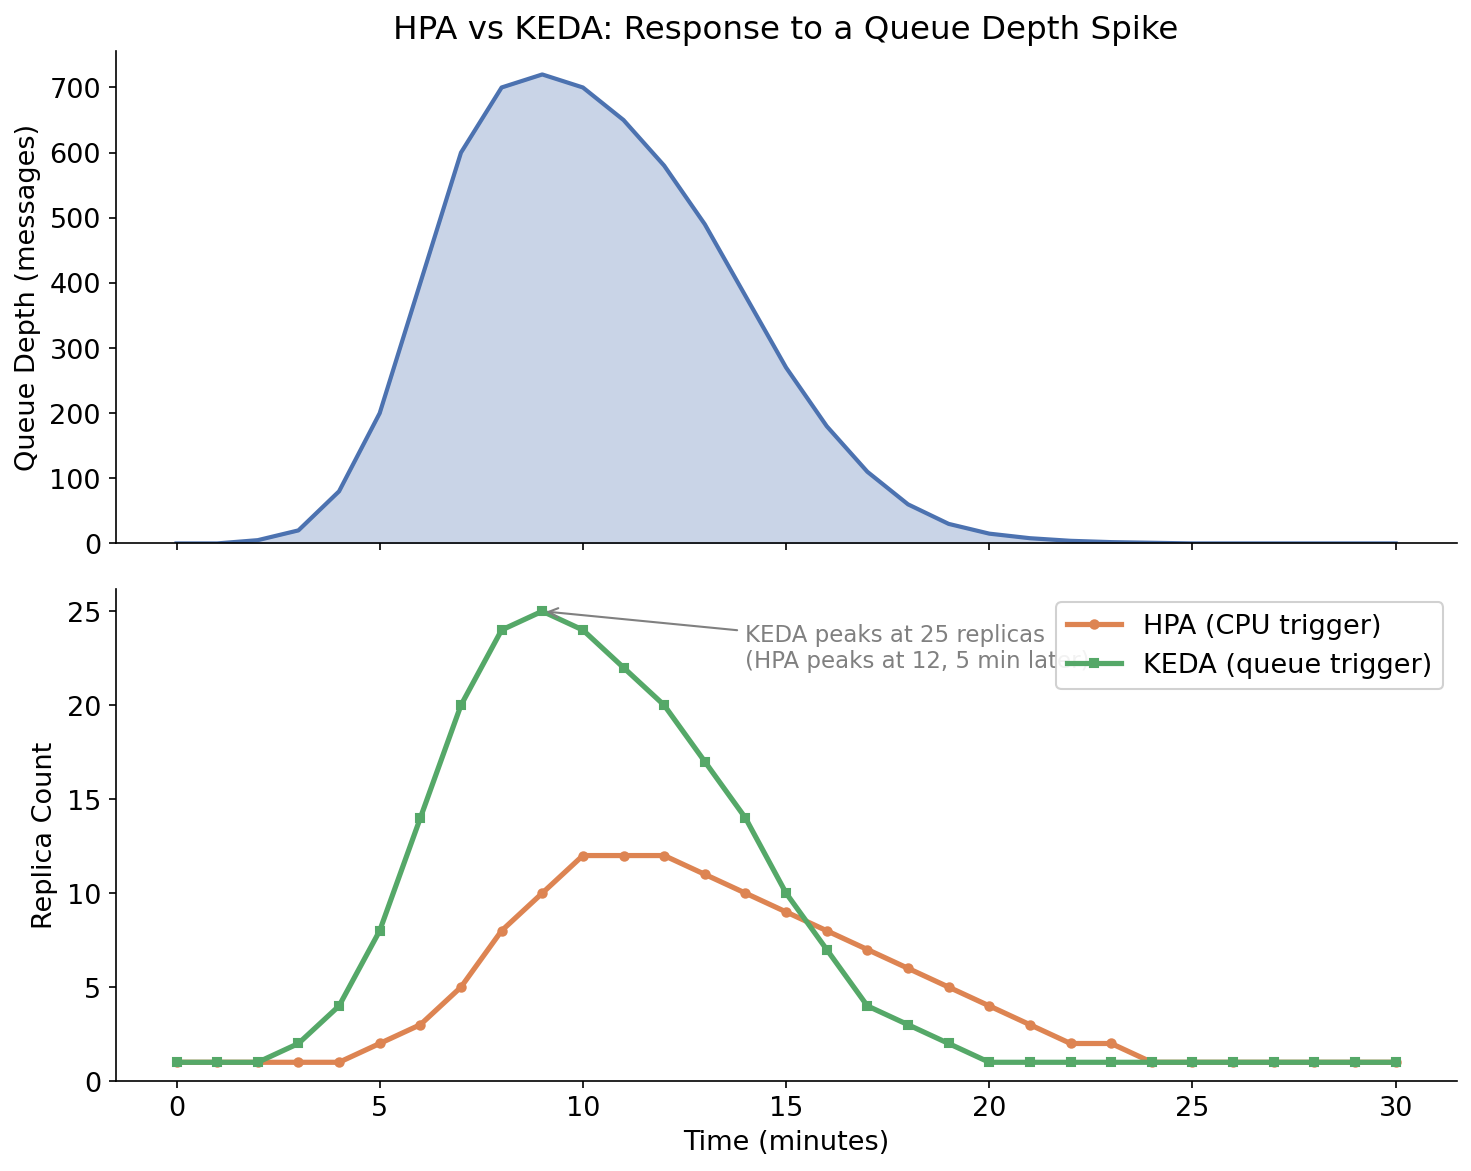
Illustrative comparison of HPA (CPU-triggered) vs KEDA (queue-depth-triggered) replica counts during a queue depth spike. KEDA responds immediately and proportionally; HPA responds only after CPU rises from backed-up processing.
KEDA Scaler Examples
Redis List:
triggers:
  - type: redis
    metadata:
      address: redis-service:6379
      listName: job-queue
      listLength: "10"    # 10 jobs per replica
Kafka Consumer Group Lag:
triggers:
  - type: kafka
    metadata:
      bootstrapServers: kafka-broker:9092
      consumerGroup: payment-processor
      topic: payment-events
      lagThreshold: "50"    # 50 messages of lag per replica
HTTP Traffic (via KEDA HTTP Add-on):
triggers:
  - type: http
    metadata:
      url: http://my-service.production.svc.cluster.local
      targetPendingRequests: "100"
Cron (predictive scaling):
triggers:
  - type: cron
    metadata:
      timezone: America/New_York
      start: "0 8 * * 1-5"    # Scale up at 8 AM weekdays
      end: "0 18 * * 1-5"     # Scale down at 6 PM weekdays
      desiredReplicas: "10"
Cron triggers are useful when you know your traffic pattern. Combine them with a queue trigger to handle both the predictable baseline and unexpected spikes.
Vertical Pod Autoscaler: Right-Sizing Resource Requests
While HPA and KEDA control replica count (horizontal scaling), VPA adjusts the CPU and memory requests and limits on existing pods (vertical scaling).
Why this matters: incorrect resource requests are one of the most common causes of pod OOM kills and node resource waste. A pod with memory: 256Mi that regularly uses 600Mi gets OOM-killed. A pod with memory: 2Gi that uses 150Mi wastes 1.85Gi on every node it runs on.
VPA watches actual resource usage over time and produces recommendations. It has three modes:
| Mode | What it does |
|---|---|
Off | Collect data and produce recommendations only. No changes. |
Initial | Set requests at pod creation time only. Won’t restart running pods. |
Auto | Actively update requests. Restarts pods to apply changes. |
apiVersion: autoscaling.k8s.io/v1
kind: VerticalPodAutoscaler
metadata:
  name: api-server-vpa
  namespace: production
spec:
  targetRef:
    apiVersion: apps/v1
    kind: Deployment
    name: api-server
  updatePolicy:
    updateMode: "Off"    # Start with recommendations only
  resourcePolicy:
    containerPolicies:
      - containerName: api-server
        minAllowed:
          cpu: 50m
          memory: 64Mi
        maxAllowed:
          cpu: 2000m
          memory: 2Gi
Start with updateMode: "Off". After a few days or a week of production traffic, check the VPA’s recommendations:
kubectl describe vpa api-server-vpa -n productionThe output shows the recommended CPU and memory requests based on observed usage. Apply them to your Deployment manifests, test in staging, and deploy. Move to Initial mode once you trust the numbers.
Don’t use Auto mode carelessly. VPA in Auto mode restarts pods to apply changes. In a small deployment with a single replica, this causes downtime. For anything requiring high availability, treat VPA as a recommendation tool and apply changes through your normal deployment process.
VPA and HPA Together
VPA and HPA can conflict if both manage the same metric. If VPA raises CPU requests for a pod and HPA is scaling on CPU utilization, the scaling math changes — utilization is resource usage divided by request, so larger requests mean lower reported utilization, which can cause HPA to scale down unexpectedly.
The safe combination: use HPA or KEDA for replica scaling, use VPA for resource request tuning, but configure VPA to only manage requests it’s not competing with. Specifically:
- HPA on CPU + VPA: avoid VPA managing CPU requests. Use
controlledResources: ["memory"]in VPA to limit it to memory only. - KEDA on queue depth + VPA: safe to let VPA manage both CPU and memory, since KEDA’s trigger isn’t affected by resource requests.
# VPA managed memory only — safe to combine with CPU-based HPA
resourcePolicy:
  containerPolicies:
    - containerName: api-server
      controlledResources: ["memory"]
Goldilocks: VPA Recommendations in a Dashboard
Running VPA in Off mode and manually checking kubectl describe vpa across dozens of deployments doesn’t scale. Goldilocks (open source, by Fairwinds) runs VPA in recommendation mode across your cluster and exposes the recommendations in a web dashboard.
Install with Helm:
helm repo add fairwinds-stable https://charts.fairwinds.com/stable
helm install goldilocks fairwinds-stable/goldilocks \
  --namespace goldilocks \
  --create-namespace

# Enable Goldilocks for a namespace
kubectl label namespace production goldilocks.fairwinds.com/enabled=true
Goldilocks creates a VPA object in Off mode for every Deployment in labeled namespaces, collects recommendations, and shows them in a dashboard with the current requests alongside. It also generates the YAML for applying the recommendations.
For teams managing 10+ deployments, this turns resource right-sizing from a manual chore into a periodic review process.
Practical Setup Sequence
For a new production cluster:
-
Deploy KEDA if your workloads have non-CPU triggers (queues, events, cron). Use KEDA’s Helm chart. Configure ScaledObjects per workload.
-
Set initial resource requests conservatively. It’s better to start with requests that are slightly too high (some waste) than too low (OOM kills).
-
Deploy Goldilocks after the cluster has been running for at least a week under realistic load. Review the dashboard, apply recommendations through your normal deployment process.
-
Add VPA in Initial mode for workloads that pass through the Goldilocks review. This keeps new pods right-sized as workloads evolve.
-
Combine KEDA + VPA on queue-processing deployments. KEDA handles replica count based on queue depth. VPA handles memory requests based on actual usage. Neither interferes with the other.
For existing clusters running HPA on all workloads, the highest-leverage change is usually Goldilocks — reclaiming wasted memory requests across a cluster often frees enough capacity to defer hardware expansion.
Cluster Autoscaler: The Missing Layer
KEDA and HPA scale pods within a node’s capacity. When all nodes are full, new pods pend. The Cluster Autoscaler (or Karpenter, which is replacing it on AWS) scales the nodes themselves.
KEDA + Cluster Autoscaler form a complete scale-out stack: KEDA adds replicas as queue depth rises, Cluster Autoscaler adds nodes as pods pending due to insufficient resources, the two work independently and cooperatively.
Karpenter (now CNCF-graduated) improves on Cluster Autoscaler by provisioning the exact right node size for pending pods rather than scaling up one predefined node group at a time. On AWS, it launches nodes in under a minute. If you’re on EKS, Karpenter is worth evaluating as the replacement.
The Bottom Line
HPA is the right starting point and remains appropriate for stateless HTTP services that scale on request load. KEDA, VPA, and Goldilocks address specific gaps.
Start with Goldilocks to right-size existing workloads — the memory recovery usually pays for the time invested. Add KEDA where queue-depth or event-driven triggers are the natural signal. Use VPA’s recommendations to keep resource requests accurate as workloads change.
The combination is more operationally involved than HPA alone, but the payoff is workloads that scale correctly under their actual access pattern, nodes that aren’t 70% wasted by over-provisioned requests, and queue consumers that drain backlogs in minutes rather than getting stuck with CPU-based scaling that can’t see the actual problem.
Sponsored
More from this category
More from Cloud & Infrastructure
 R.01
R.01 PostgreSQL Performance Tuning: EXPLAIN ANALYZE, Indexes, and Query Debugging
 R.02
R.02 Neon Postgres: Serverless Database Branching Changes How Teams Work
 R.03
R.03 Database Connection Pooling in 2026: PgBouncer, Supabase, and Prisma Accelerate
Sponsored
The dispatch
Working notes from
the studio.
A short letter twice a month — what we shipped, what broke, and the AI tools earning their keep.
Discussion
Join the conversation.
Comments are powered by GitHub Discussions. Sign in with your GitHub account to leave a comment.
Sponsored